Multiple Choice
The diagram below shows desired aggregate expenditure for a hypothetical economy.Assume the following features of this economy: • marginal propensity to consume (mpc) = 0.75
• net tax rate (t) = 0.20
• no foreign trade
• fixed price level
• all expenditure and income figures are in billions of dollars. 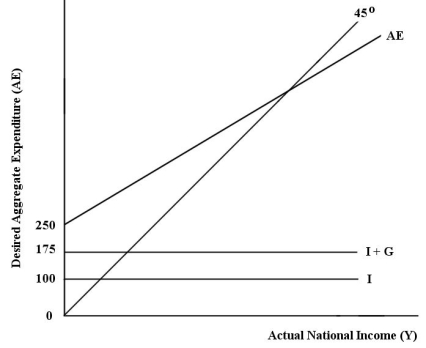 FIGURE 22-2
Refer to Figure 22-2.What is the equilibrium national income in this economy?
A) $187.50
B) $294
C) $333.34
D) $625
E) $1666.67
Correct Answer:

Verified
Correct Answer:
Verified
Q93: Consider the following news headline: "Minister of
Q94: When economists use the term "budget surplus"
Q95: <img src="https://d2lvgg3v3hfg70.cloudfront.net/TB7713/.jpg" alt=" FIGURE 22-5 Refer
Q96: The diagram below shows desired aggregate expenditure
Q97: Consider the general form of the consumption
Q99: If the price level is taken as
Q100: In a simple macro model where the
Q101: Suppose Y = 400 and the government's
Q102: Consider the government's budget balance.Suppose G =
Q103: A fall in the Canadian-dollar price of