Multiple Choice
The diagram below shows desired aggregate expenditure for a hypothetical economy.Assume the following features of this economy: • marginal propensity to consume (mpc) = 0.80
• net tax rate (t) = 0.15
• no foreign trade
• fixed price level
• all expenditure and income figures are in billions of dollars. 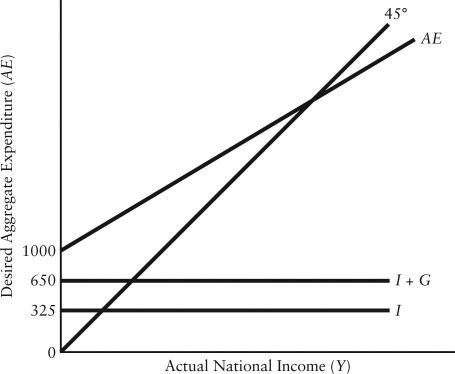 FIGURE 22-3
Refer to Figure 22-3.What is the equilibrium national income in this economy?
A) $1470.59
B) $3125.00
C) $1975.00
D) $5000.00
E) $6171.87
Correct Answer:

Verified
Correct Answer:
Verified
Q100: In a simple macro model where the
Q101: Suppose Y = 400 and the government's
Q102: Consider the government's budget balance.Suppose G =
Q103: A fall in the Canadian-dollar price of
Q104: An increase in the value of the
Q106: Consider the simplest macro model with a
Q107: Consider a simple macro model with a
Q108: Consider a consumption function in a simple
Q109: Consider the government's budget balance.Suppose G =
Q110: Consider a macro model with a constant