Multiple Choice
The table below shows total output for an economy over 2 years. 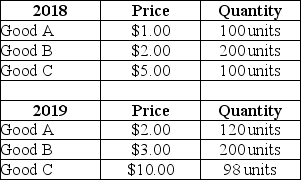 TABLE 20-5 Refer to Table 20-5.The nominal Gross Domestic Product in 2019 was
A) $700.
B) $840.
C) $980.
D) $1740.
E) $1820.
Correct Answer:

Verified
Correct Answer:
Verified
Related Questions
Q61: The table below shows total output for
Q62: An example of an item that would
Q63: In national-income accounting,"double counting"<br>A)occurs when the value
Q64: Historically,nominal GDP has increased faster than real
Q65: Statistics Canada excludes from GDP the value
Q67: Country X is highly ranked in terms
Q68: If a firm's depreciation exceeds its gross
Q69: Consider the circular flow of expenditure and
Q70: Suppose nominal national income in some country
Q71: The table below includes data for a