Multiple Choice
The table below shows total output for an economy over 3 years. 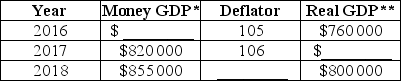 * millions of dollars ** real GDP measured in millions of 2010 dollars
TABLE 20-7
Refer to Table 20-7.The implicit GDP deflator for 2018 is approximately
A) 94.
B) 107.
C) 108.
D) 109.
E) 110.
Correct Answer:

Verified
Correct Answer:
Verified
Q47: The table below shows total output for
Q48: Measures of GDP may understate the economic
Q49: When calculating GDP from the expenditure side,which
Q50: The table below includes data for a
Q51: The table below shows total output for
Q53: When measuring actual gross domestic product from
Q54: Consider the circular flow of expenditure and
Q55: Suppose a Canadian firm imports $1000 worth
Q56: The table below includes data for a
Q57: In macroeconomics,the term "capital goods" refers to<br>A)the