Multiple Choice
The table below shows total output for an economy over 2 years. 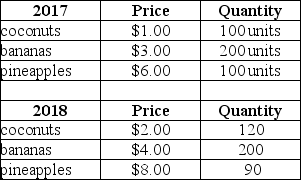 TABLE 20-8 Refer to Table 20-8.The implicit GDP deflator in 2018 (using 2017 as the base year) is
A) 71.59.
B) 100.
C) 103.4.
D) 114.6.
E) 139.7.
Correct Answer:

Verified
Correct Answer:
Verified
Related Questions
Q99: The table below shows total output for
Q100: The table below shows total output for
Q101: Why are transfer payments excluded from the
Q102: The table below includes data for a
Q103: The table below shows total output for
Q105: Suppose that in 2018,ABC Corporation produced $6
Q106: In macroeconomics,what is meant by the term
Q107: Consider the circular flow of expenditure and
Q108: Jodie's Bakery generates a yearly revenue of
Q109: GDP from the expenditure side is equal