Multiple Choice
The table below displays hypothetical demand and supply schedules for the market for overnight parcel deliveries in Canada. 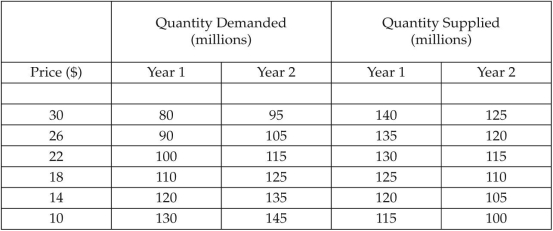 TABLE 3-4 Refer to Table 3-4.Which of the following statements best describes the change in equilibrium price and quantity in this market between Year 1 and Year 2?
A) The demand curve has shifted to the left,the supply curve has shifted to the right; as a result equilibrium price is lower and equilibrium quantity is higher.
B) The demand curve has shifted to the left,the supply curve has shifted to the left; as a result equilibrium price is higher and equilibrium quantity is lower.
C) The demand curve has shifted to the right,the supply curve has shifted to the left; as a result equilibrium price is higher and equilibrium quantity is lower.
D) The demand curve has shifted to the left,the supply curve has shifted to the right; as a result equilibrium price is higher and equilibrium quantity is lower.
E) There is no change in equilibrium price or quantity from Year 1 to Year 2.
Correct Answer:

Verified
Correct Answer:
Verified
Q104: <img src="https://d2lvgg3v3hfg70.cloudfront.net/TB7713/.jpg" alt=" FIGURE 3-2 Refer
Q105: The term "quantity supplied" is the amount
Q106: <img src="https://d2lvgg3v3hfg70.cloudfront.net/TB7713/.jpg" alt=" FIGURE 3-6 Refer
Q107: The "law of demand" hypothesizes that,other things
Q108: Consider the global market for some mineral,X.In
Q110: <img src="https://d2lvgg3v3hfg70.cloudfront.net/TB7713/.jpg" alt=" FIGURE 3-1 Refer
Q111: Suppose the price of good X increases
Q112: The supply and demand schedules for dozens
Q113: The supply and demand schedules for the
Q114: In which statement is the term "demand"