menu-iconExamlexExamLexServices

Discover

Ask a Question
  1. All Topics
  2. Topic
    Business
  3. Study Set
    Macroeconomics
  4. Exam
    Exam 3: Demand, supply, and Price
  5. Question
    FIGURE 3-3 Refer to Figure 3-3
Solved

FIGURE 3-3 Refer to Figure 3-3

Question 21

Question 21

Multiple Choice

  FIGURE 3-3 Refer to Figure 3-3.At a price of P<sub>2</sub> there would be excess demand equal to A) 0. B) Q<sub>1</sub>Q<sub>5</sub><sub>.</sub> C) Q<sub>2</sub>Q<sub>4</sub><sub>.</sub> D) Q<sub>1</sub>Q<sub>3</sub><sub>.</sub> E) Q<sub>3</sub> Q<sub>5</sub><sub>.</sub> 
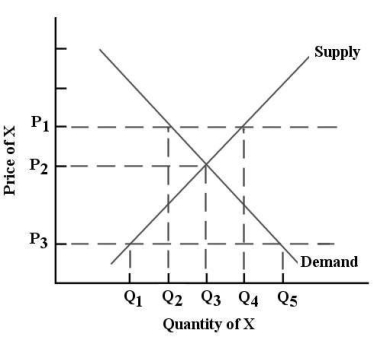
FIGURE 3-3 Refer to Figure 3-3.At a price of P2 there would be excess demand equal to


A) 0.
B) Q1Q5.
C) Q2Q4.
D) Q1Q3.
E) Q3 Q5.

Correct Answer:

verifed

Verified

Unlock this answer now
Get Access to more Verified Answers free of charge

Related Questions

Q16: Consider cars and gasoline.Other things being equal,when

Q17: <img src="https://d2lvgg3v3hfg70.cloudfront.net/TB7713/.jpg" alt=" FIGURE 3-6 Refer

Q18: <img src="https://d2lvgg3v3hfg70.cloudfront.net/TB7713/.jpg" alt=" FIGURE 3-1 Refer

Q19: Assume that apples and oranges are substitute

Q20: A variable that is a "stock"<br>A)is measured

Q22: <img src="https://d2lvgg3v3hfg70.cloudfront.net/TB7713/.jpg" alt=" FIGURE 3-3 Refer

Q23: Which statement best describes a "demand schedule"?<br>A)a

Q24: The term "quantity demanded" refers to the<br>A)total

Q25: A demand curve represents graphically<br>A)a functional statement

Q26: Which of the following statements is correct

Examlex

ExamLex

About UsContact UsPerks CenterHomeschoolingTest Prep

Work With Us

Campus RepresentativeInfluencers

Links

FaqPricingChrome Extension

Download The App

Get App StoreGet Google Play

Policies

Privacy PolicyTerms of ServiceHonor CodeCommunity Guidelines

Scan To Download

qr-code

Copyright © (2025) ExamLex LLC.

Privacy PolicyTerms Of ServiceHonor CodeCommunity Guidelines