Multiple Choice
The table below shows hypothetical data for volumes of e-books and hardcover books sold over a 3-year period in a particular city. 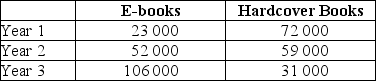 TABLE 2-3 Refer to Table 2-3.Between Year 1 and Year 3,what is the percentage change in sales of hardcover books?
A) 0.569%
B) 56.9%
C) -56.9%
D) -0.569%
E) -569%
Correct Answer:

Verified
Correct Answer:
Verified
Q106: An economist has data showing average apartment
Q107: Choose the statement that best characterizes an
Q108: The scientific approach to economic inquiry involves<br>A)choosing
Q109: An assertion about the desirability of reducing
Q110: Which is an example of a positive
Q112: Which of the following best describes the
Q113: You have collected data over the summer
Q114: Suppose we observe that consumption of electricity
Q115: Which of the following pairs of words
Q116: Which is the best description of positive