Multiple Choice
The table below shows the approximate value of Canada's crude oil and natural gas exports over a 5-year period.The amounts shown are billions of dollars. 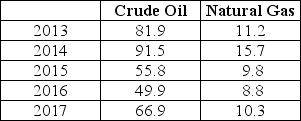 TABLE 2-7 Refer to Table 2-7.Assume that 2013 is the base year,with an index number = 100.What is the percentage change in the value of exports of crude oil from 2013 to 2017?
A) -18.3%
B) -183.2%
C) -100%
D) 18.3%
E) 183.2%
Correct Answer:

Verified
Correct Answer:
Verified
Q9: The table below shows hypothetical monthly cell
Q10: Negatively related variables change such that as
Q11: The table below shows the approximate value
Q12: Consider the following equation: Y = 10
Q13: <img src="https://d2lvgg3v3hfg70.cloudfront.net/TB7713/.jpg" alt=" FIGURE 2-4 Refer
Q15: In a co-ordinate graph with Y on
Q16: An economist has data showing Canadian disposable
Q17: Suppose a particular theory predicts that on
Q18: Suppose Jillian will spend $250 on books
Q19: An economist collects data comparing per-capita expenditures