Multiple Choice
The table below shows the approximate value of Canada's crude oil and natural gas exports over a 5-year period.The amounts shown are billions of dollars. 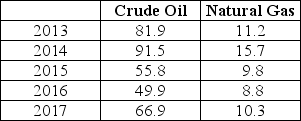 TABLE 2-7 Refer to Table 2-7.Assume that 2013 is the base year,with an index number = 100.What is the percentage change in the value of exports of crude oil from 2016 to 2017?
A) 0.34%
B) 34%
C) -0.34%
D) -34%
E) -18%
Correct Answer:

Verified
Correct Answer:
Verified
Q29: When studying economic data,index numbers are especially
Q30: According to the Bank of Canada's website,Canada's
Q31: The table below shows the approximate value
Q32: Economics is scientific because<br>A)economists routinely conduct controlled
Q33: The table below shows hypothetical monthly cell
Q35: On a coordinate graph with y on
Q36: Suppose an economist tells you that,on average,people
Q37: The table below shows hypothetical data for
Q38: Which of the following is a normative
Q39: The table below shows hypothetical data for