Multiple Choice
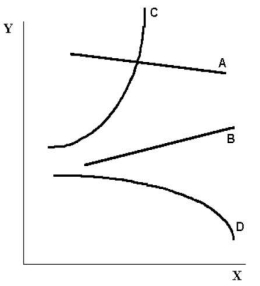 FIGURE 2-2 Refer to Figure 2-2.The slope of curve A is
A) positive and constant.
B) negative and constant.
C) positive and changing.
D) negative and changing.
E) undefined.
Correct Answer:

Verified
Correct Answer:
Verified
Related Questions
Q71: The statement that a 2% increase in
Q72: Let 1 stand for "any given period"
Q73: Suppose economists at the World Bank develop
Q74: Suppose an economist tells you that the
Q75: In a co-ordinate graph with Y on
Q77: When considering how a family's level of
Q78: A hypothesis (or a prediction)is a statement
Q79: The table below shows hypothetical data for
Q80: <img src="https://d2lvgg3v3hfg70.cloudfront.net/TB7713/.jpg" alt=" FIGURE 2-3 Refer
Q81: The slope of a straight line is