Multiple Choice
The diagram below shows two production possibilities boundaries for Country X. 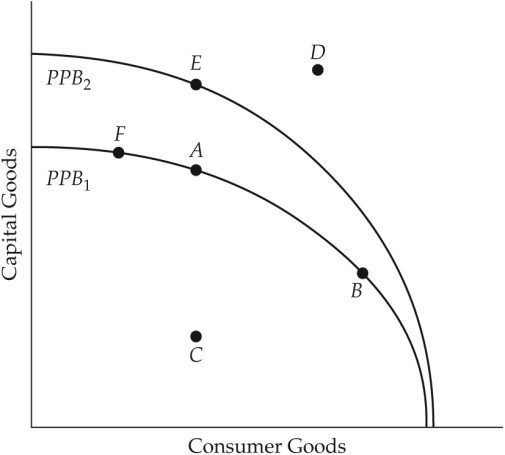 FIGURE 1-4 Refer to Figure 1-4.If Country X were producing at point C,
A) the opportunity cost of moving to point A is to give up an increase in the production of consumer goods.
B) the opportunity cost of moving to point A is zero.
C) the opportunity cost of moving to point A is to give up some capital goods.
D) this is the maximum output possible from given resources.
E) it is not possible to move to any point on PPB1 or PPB2 without technological progress.
Correct Answer:

Verified
Correct Answer:
Verified
Q32: The opportunity cost of producing good A
Q33: Scarcity implies that choices must be made.Making
Q34: Suppose one unit of labour can produce
Q35: Madeleine allows herself $100 per month for
Q36: With a budget of $200 million,the government
Q38: Madeleine allows herself $100 per month for
Q39: Economists usually assume that individuals and firms,respectively,maximize<br>A)income
Q40: Specialization of labour led to greater efficiency
Q41: Many economies in central and Eastern Europe,including
Q42: Figure 1-7 shows the production possibilities boundary