Multiple Choice
The diagram below shows two production possibilities boundaries for Country X. 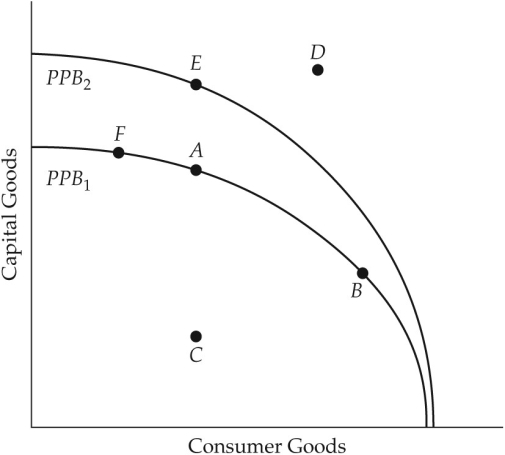 FIGURE 1-4 Refer to Figure 1-4.Growth in the country's productive capacity is illustrated by
A) a point like D outside the boundary.
B) a movement from a point inside the boundary such as C to the boundary.
C) the movement between points on a given boundary.
D) a single point such as A on the boundary.
E) an outward shift of the boundary,for example from PPB1 to PPB2.
Correct Answer:

Verified
Correct Answer:
Verified
Q24: On a diagram of a production possibilities
Q25: Trade did not take place before the
Q26: It has been observed that university enrollment
Q27: Suppose you own a courier service and
Q28: <img src="https://d2lvgg3v3hfg70.cloudfront.net/TB7713/.jpg" alt=" FIGURE 1-5 Refer
Q30: In the Canadian economy,most decisions regarding resource
Q31: Which of the following statements about specialization
Q32: The opportunity cost of producing good A
Q33: Scarcity implies that choices must be made.Making
Q34: Suppose one unit of labour can produce