Multiple Choice
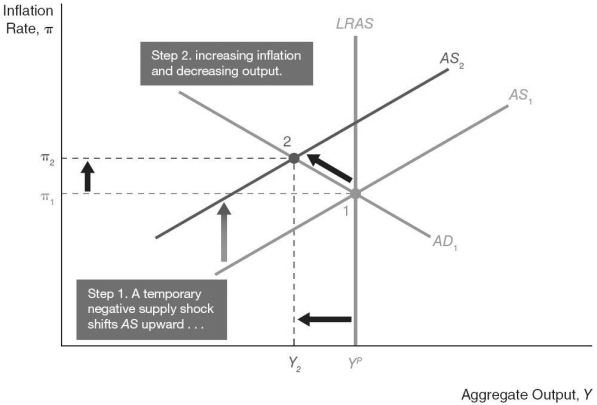
-In the figure above, at point 2, the shift of the aggregate supply curve from AS1 to AS2 is a result of ________ wages that ________ production cost.
A) increasing; increase
B) increasing; reduce
C) decreasing; decrease
D) decreasing; increase
Correct Answer:

Verified
Correct Answer:
Verified
Q2: A theory of aggregate economic fluctuations called
Q4: Everything else held constant,an increase in government
Q8: Everything else held constant,aggregate demand increases when<br>A)taxes
Q36: Explain through the component parts of aggregate
Q70: Suppose the Canadian economy is producing at
Q71: Suppose the economy is producing below the
Q74: This theory views shocks to tastes (workers'
Q74: Suppose the economy is producing at the
Q89: According to aggregate demand and supply analysis,the
Q104: By analyzing aggregate demand through its component