menu-iconExamlexExamLexServices

Discover

Ask a Question
  1. All Topics
  2. Topic
    Business
  3. Study Set
    Money Banking
  4. Exam
    Exam 23: Aggregate Demand and Supply Analysis
  5. Question
    -In the Figure Above, Output Levels Below Y<sub>n</sub> Will Cause
Solved

-In the Figure Above, Output Levels Below Yn Will Cause

Question 12

Question 12

Multiple Choice

  -In the figure above, output levels below Y<sub>n</sub> will cause the aggregate ________ function to shift to the ________. A)  supply; right B)  supply; left C)  demand; left D)  A and C only
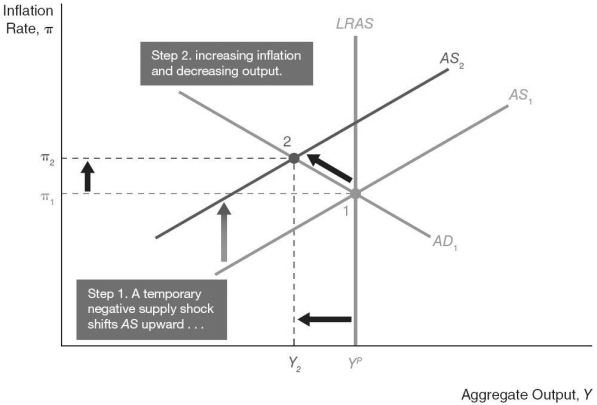
-In the figure above, output levels below Yn will cause the aggregate ________ function to shift to the ________.


A) supply; right
B) supply; left
C) demand; left
D) A and C only

Correct Answer:

verifed

Verified

Unlock this answer now
Get Access to more Verified Answers free of charge

Related Questions

Q8: Explain why the short-run aggregate supply curve

Q13: According to aggregate demand and supply analysis,the

Q17: Economists believe the natural rate of unemployment

Q24: Everything else held constant,an increase in government

Q42: Everything else held constant,when output is _

Q47: Everything else held constant,when actual output exceeds

Q49: One way to derive aggregate demand is

Q54: The total quantity of an economy's final

Q55: According to aggregate demand and supply analysis,the

Q58: The long-run aggregate supply curve shifts to

Examlex

ExamLex

About UsContact UsPerks CenterHomeschoolingTest Prep

Work With Us

Campus RepresentativeInfluencers

Links

FaqPricingChrome Extension

Download The App

Get App StoreGet Google Play

Policies

Privacy PolicyTerms of ServiceHonor CodeCommunity Guidelines

Scan To Download

qr-code

Copyright © (2025) ExamLex LLC.

Privacy PolicyTerms Of ServiceHonor CodeCommunity Guidelines