Multiple Choice
Use the following to answer questions .
Exhibit: Consumption Functions
Figure 13-3 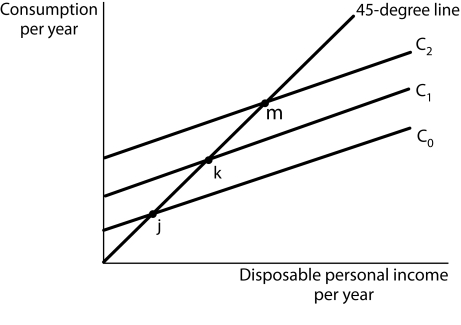
-(Exhibit: Consumption Functions) Upward shifts of the consumption function, for example from C0 to C1 to C2 demonstrate
A) an increase in the marginal propensity to save.
B) increases in the amount of consumption for a given level of disposable income.
C) increases in the amount of disposable income available for consumption.
D) a decrease in the marginal propensity to save.
Correct Answer:

Verified
Correct Answer:
Verified
Q106: In the simple aggregate expenditure model where
Q107: Consider a simple aggregate expenditure model where
Q108: Personal saving equals<br>A) gross domestic income −
Q109: In the simple aggregate expenditure model where
Q110: The amount of consumption at each level
Q112: If consumption is given by C =
Q113: Suppose at each price level, autonomous aggregate
Q114: In a graph with real GDP on
Q115: The wealth effect is the tendency for<br>A)
Q116: Personal saving is<br>A) total income not spent