Multiple Choice
Which of the lines on the figure below is the best representation of the relationship between the volume of a gas and its pressure, other factors remaining constant? 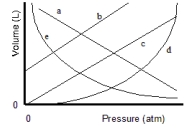
A) a
B) b
C) c
D) d
E) e
Correct Answer:

Verified
Correct Answer:
Verified
Related Questions
Q8: A sample of nitrogen gas is confined
Q14: Calculate the temperature of an argon sample
Q15: A sample of carbon dioxide gas at
Q28: Calculate the root-mean-square speed of methane, CH<sub>4
Q29: Mercury is 13.6 times as dense as
Q56: According to the kinetic theory of gases,
Q71: A flask containing argon gas is connected
Q77: Hydrogen peroxide was catalytically decomposed and 75.3
Q78: If the molecular mass of a gas
Q81: If 0.750 L of argon at 1.50