Multiple Choice
Use Figure 1 to answer questions
Figure SEQ Figure 1: Elasticities of Demand 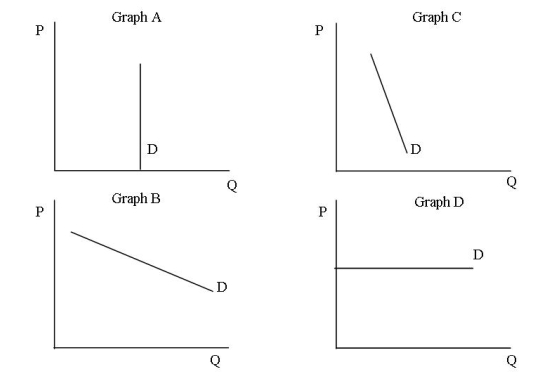
-Which of the graphs illustrate a relatively inelastic demand curve?
A) Graph A
B) Graph B
C) Graph C
D) Graph D
Correct Answer:

Verified
Correct Answer:
Verified
Related Questions
Q1: Which of the following measures the price
Q2: Which of the following would indicate an
Q3: Reference: Use Figure 2 to answer questions
Q5: The ratio of the percentage change in
Q6: Use the following information to answer
Q7: If the price of a widget increases
Q8: Price elasticity of demand measures<br>A)The responsiveness of
Q9: If the price elasticity of demand is
Q10: Use the following information to answer
Q11: All of the following are determinants of