Multiple Choice
Use Figure 1 to answer questions
Figure SEQ Figure 1: Elasticities of Demand 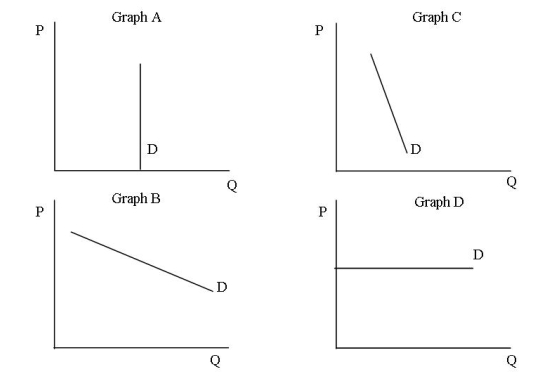
-Which of the graphs illustrate a good whose percentage change in quantity demanded is less than the percentage change in price?
A) Graph A
B) Graph B
C) Graph C
D) Graph D
Correct Answer:

Verified
Correct Answer:
Verified
Related Questions
Q18: You are the owner of a quick
Q19: The price of a good increases by
Q20: The local city council wants to increase
Q21: Use Figure 1 to answer questions <br>Figure
Q22: You have exclusive rights for the sale
Q24: The amount of money earned when a
Q25: If the elasticity of demand is greater
Q26: Reference: Use Figure 2 to answer questions
Q27: The measurement of responsiveness between two variables
Q28: Use Figure 1 to answer questions <br>Figure