Essay
The diagram below shows the urinary metabolic ratio as a measure of CYP2D6 enzyme activity in a total of about 700 individuals. After individuals were given a standard dose of a drug known to be metabolized by CYP2D6 the metabolic ratio was obtained by measuring the urinary concentration of the substrate drug and dividing it by the concentration of the metabolic product resulting from CYP2D6 acting on the drug. Classify individuals with metabolic ratios in the four ranges shown as (a) to (d) in terms of their drug-metabolizing abilities and describe the expected genotypes associated with each group. 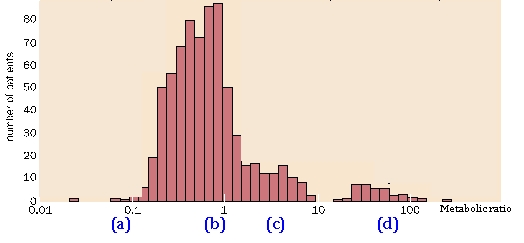
Correct Answer:

Verified
a) This falls within the range of ultraf...View Answer
Unlock this answer now
Get Access to more Verified Answers free of charge
Correct Answer:
Verified
View Answer
Unlock this answer now
Get Access to more Verified Answers free of charge
Q13: Concerning transport of genes into human (or
Q14: There are three broad classes to disease
Q15: Which of the following statements, if any,
Q16: Which of the following descriptions, if any,
Q17: Which, if any, of the following statements
Q19: What possible clinical applications might be derived
Q20: Hematopoietic stem cells can be important target
Q21: With regard to treatment of inborn errors
Q22: Many of the genes that produce the
Q23: Sometimes, a prescribed drug can be dangerous,