Multiple Choice
The figure below shows the result of a price fixing scheme that raised price above competitive levels at point C to a price of $15 at point M. 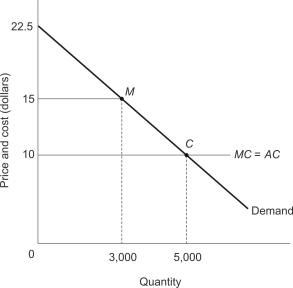 By forming this price-fixing cartel,producers gained $__________ of producer surplus,while consumers lost $__________ of consumer surplus.
A) $15,000; $10,000
B) $15,000; $20,000
C) $20,000; $10,000
D) $20,000; $5,000
Correct Answer:

Verified
Correct Answer:
Verified
Q30: The cost and demand conditions for residential
Q31: A municipal water utility employs quasi-fixed
Q32: "Market power"<br>A)is the ability to lower costs
Q33: When a competitively produced product has negative
Q34: When there is negative externality in production,<br>A)marginal
Q36: When social surplus is maximized in competitive
Q37: A municipal water utility employs quasi-fixed
Q38: Use the figure below,which shows the linear
Q39: When we say that market prices allocate
Q40: Price is $50 and quantity demanded is