Multiple Choice
The following graph shows the demands and marginal revenue in two markets,1 and 2,for a price discriminating firm along with total marginal revenue,MRT,and marginal cost. 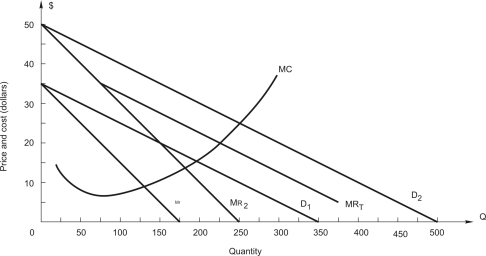 What price should the firm charge in each market?
A) P1 = $20,P2 = $32.50
B) P1 = $35,P2 = $22.50
C) P1 = $20,P2 = $20
D) P1 = $27.50,P2 = $35
E) Impossible to say because market demand is not given
Correct Answer:

Verified
Correct Answer:
Verified
Q10: To successfully practice price discrimination<br>A)the firm must
Q11: A firm faces the demand for
Q12: Gus has 20 acres of land in
Q13: A firm sells two goods (X
Q14: Refer to the following: <span
Q16: A firm sells its product to two
Q17: Drill Quest,Inc.manufactures drill bits for the
Q18: Drill Quest,Inc.manufactures drill bits for the
Q19: A firm sells two goods (X
Q20: Drill Quest,Inc.manufactures drill bits for the