Multiple Choice
The following figure shows the demand and cost curves facing a firm with market power in the short run. 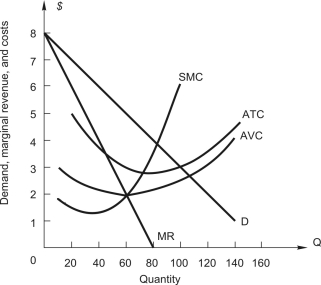 The firm earns profits of
A) $ 75.
B) $120.
C) $150.
D) $180.
E) $300.
Correct Answer:

Verified
Correct Answer:
Verified
Related Questions
Q90: Using time-series data,the demand function for
Q91: The market demand for a monopoly
Q92: In a monopolistically competitive market,<br>A)firms are small
Q93: A firm with market power faces
Q94: Refer to the following table showing
Q96: <img src="https://d2lvgg3v3hfg70.cloudfront.net/TB7882/.jpg" alt=" The above graph
Q97: Suppose that a profit-maximizing monopolist has a
Q98: The inverse demand equation for a monopoly
Q99: Columns 1 and 2 make up
Q100: A firm with market power will maximize