Multiple Choice
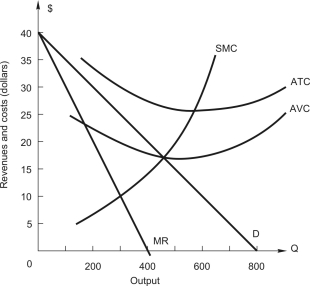 The figure above shows the demand and cost curves facing a price-setting firm.The profit-maximizing (or loss-minimizing) level of output is
A) 100
B) 200
C) 300
D) 400
E) 450
Correct Answer:

Verified
Correct Answer:
Verified
Related Questions
Q50: If firms in a monopolistically competitive industry
Q51: A firm with market power faces
Q52: To maximize its profit,a firm with two
Q53: <img src="https://d2lvgg3v3hfg70.cloudfront.net/TB7882/.jpg" alt=" The demand for
Q54: In order to maximize profit,a firm that
Q56: <img src="https://d2lvgg3v3hfg70.cloudfront.net/TB7882/.jpg" alt=" The demand for
Q57: Refer to the following table showing
Q58: Using time-series data,the demand function for
Q59: The market demand for a monopoly
Q60: Refer to the following figure showing demand