Multiple Choice
Below,the graph on the left shows long-run average and marginal cost for a typical firm in a perfectly competitive industry.The graph on the right shows demand and long-run supply for an increasing-cost industry. 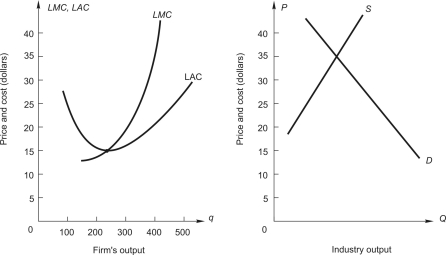 What output will the firm produce?
A) 250
B) 300
C) 350
D) 400
Correct Answer:

Verified
Correct Answer:
Verified
Q40: To answer the question,refer to the following
Q41: Total cost schedule for a competitive
Q42: <img src="https://d2lvgg3v3hfg70.cloudfront.net/TB7882/.jpg" alt=" The graph above
Q43: <img src="https://d2lvgg3v3hfg70.cloudfront.net/TB7882/.jpg" alt=" The figure above
Q44: Good W is produced in a competitive
Q46: Good Z is produced and sold in
Q47: In a perfectly competitive market<br>A)a firm faces
Q48: A consulting company estimated market demand
Q49: Which of the following is NOT a
Q50: A consulting company estimated market demand