Multiple Choice
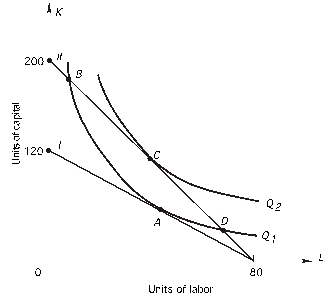 In the above graph,what is the marginal rate of technical substitution at point D?
A) less than 1.5
B) less than 2.5
C) greater than 1.5
D) greater than 2.5
Correct Answer:

Verified
Correct Answer:
Verified
Related Questions
Q18: A firm is using 500 units of
Q19: Refer to the following graph.The price of
Q20: producer is hiring 20 units of labor
Q21: Refer to the following figure.The price of
Q22: Refer to the following graph.The price of
Q24: Refer to the following figure.The price of
Q25: Following is a firm's expansion path.The
Q26: In the following graph,the price of capital
Q27: In the following graph,the price of capital
Q28: Refer to the following graph.The price of