Multiple Choice
The following graph shows the marginal and average product curves for labor,the firm's only variable input.The monthly wage for labor is $2,800.Fixed cost is $160,000. 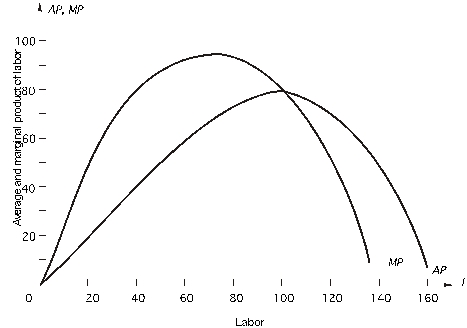 At what output does the firm reach minimum average variable cost?
A) 7,400
B) 8,000
C) 100
D) 6,000
E) 600
Correct Answer:

Verified
Correct Answer:
Verified
Q72: Given the table below,what is average
Q73: A firm is currently producing 10 units
Q74: Given the table below,what is the
Q75: The following graph shows the marginal and
Q76: <img src="https://d2lvgg3v3hfg70.cloudfront.net/TB7882/.jpg" alt=" -Assume labor-the only
Q78: A firm produces 4,000 units of output
Q79: A firm produces 4,000 units of output
Q80: out the table and answer the
Q81: Given the table below,what is the
Q82: The capital stock is fixed at