Multiple Choice
The following graph shows the marginal and average product curves for labor,the firm's only variable input.The monthly wage for labor is $2,800.Fixed cost is $160,000. 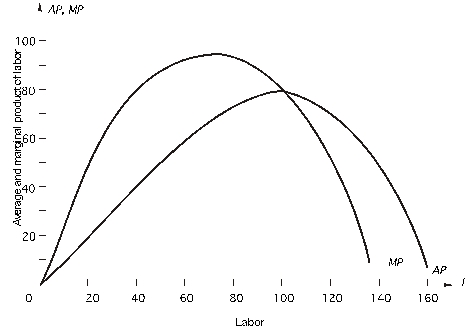 What is AVC at its minimum?
A) $80
B) $100
C) $8
D) $50
E) $35
Correct Answer:

Verified
Correct Answer:
Verified
Q95: Use the following table to answer
Q96: Use the following table to answer
Q97: The capital stock is fixed at
Q98: Frito-Lay,a division of PepsiCo,manufactures,markets and distributes a
Q99: Given the table below,what is average
Q101: If average product is increasing,then marginal product<br>A)must
Q102: Suppose that the firm's only variable input
Q103: The following graph shows the marginal and
Q104: Use the following table to answer
Q105: <img src="https://d2lvgg3v3hfg70.cloudfront.net/TB7882/.jpg" alt=" In the figure