Multiple Choice
The following graph shows the marginal and average product curves for labor,the firm's only variable input.The monthly wage for labor is $2,800.Fixed cost is $160,000. 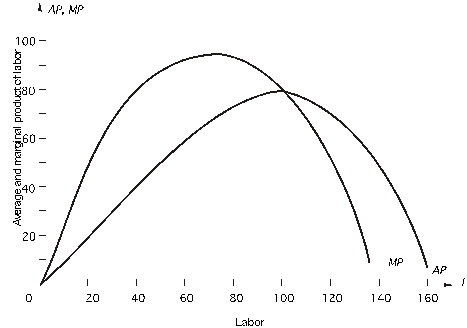 When the firm uses 120 units of labor,how much output does it produce?
A) 7,000 units
B) 70 units
C) 8,400 units
D) 9,200 units
E) 7,500 units
Correct Answer:

Verified
Correct Answer:
Verified
Q21: <img src="https://d2lvgg3v3hfg70.cloudfront.net/TB7882/.jpg" alt=" In the figure
Q22: If marginal product is decreasing,then it must
Q23: A fixed cost is<br>A)the cost of any
Q24: If a firm is producing a given
Q25: The capital stock is fixed at
Q27: production function measures the relation between<br>A)input prices
Q28: Based on the following table,what is
Q29: For a short-run production function in which
Q30: Use the following table to answer
Q31: <img src="https://d2lvgg3v3hfg70.cloudfront.net/TB7882/.jpg" alt=" -Assume labor-the only