Multiple Choice
The following graph shows the marginal and average product curves for labor,the firm's only variable input.The monthly wage for labor is $2,800.Fixed cost is $160,000. 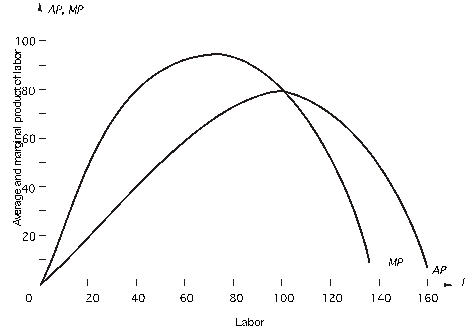 When the firm uses 120 units of labor,what is its marginal cost at this output?
A) $65
B) $70
C) $50
D) $56
E) $120
Correct Answer:

Verified
Correct Answer:
Verified
Q87: A short-run cost function assumes that<br>A)the level
Q88: A firm's cost of production is affected
Q89: Use the following table to answer
Q90: <img src="https://d2lvgg3v3hfg70.cloudfront.net/TB7882/.jpg" alt=" In the figure
Q91: Average fixed cost<br>A)increases as output increases.<br>B)decreases as
Q93: Based on the following table,what is
Q94: Suppose a firm is hiring 20 workers
Q95: Use the following table to answer
Q96: Use the following table to answer
Q97: The capital stock is fixed at