Multiple Choice
The following graph shows the marginal and average product curves for labor,the firm's only variable input.The monthly wage for labor is $2,800.Fixed cost is $160,000. 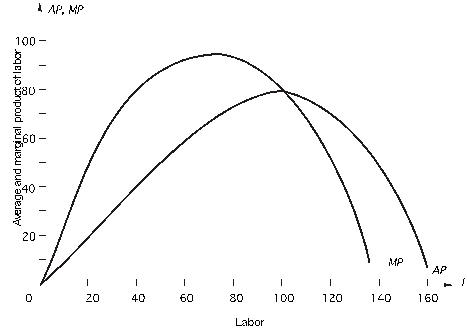 When the firm uses 120 units of labor,what is average total cost at this output?
A) $59
B) $40
C) $190
D) $84
E) $120
Correct Answer:

Verified
Correct Answer:
Verified
Q3: Suppose you run a pizza shop and
Q4: out the table and answer the
Q5: <span class="ql-formula" data-value="\begin{array}{c}\begin{array}{c}\text {Units of}\\\text {Labor}\\\hline1 \\2
Q6: Use the following table to answer
Q7: Suppose that the firm's only variable input
Q9: The following graph shows the marginal and
Q10: If labor is fixed at 5
Q11: The marginal product of labor<br>A)measures how output
Q12: Suppose a firm is hiring 20 workers
Q13: Suppose that the firm's only variable input