Multiple Choice
the figure below,which shows a linear demand curve and the associated total revenue curve,to answer the question. 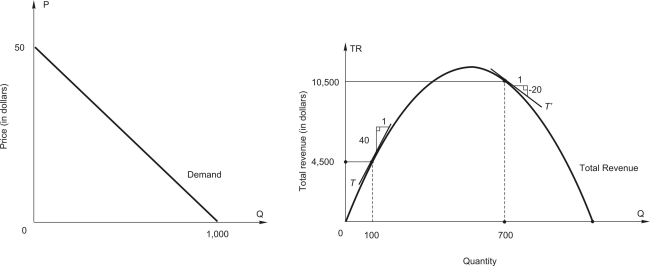 The price for which 100 units can be sold is $_____.
A) 10
B) 15
C) 25
D) 45
E) 50
Correct Answer:

Verified
Correct Answer:
Verified
Q35: Perfume industry statistics show that over the
Q36: Interior Department recently announced that it will
Q37: <img src="https://d2lvgg3v3hfg70.cloudfront.net/TB7882/.jpg" alt=" In the figure
Q38: According to the following figure,demand is unitary
Q39: <img src="https://d2lvgg3v3hfg70.cloudfront.net/TB7882/.jpg" alt=" In the figure
Q41: the figure below,which shows a linear demand
Q42: To answer the question,refer to the
Q43: Refer to the following figure.When quantity demanded
Q44: Refer to the following figure.At a price
Q45: If the price elasticity of demand for