menu-iconExamlexExamLexServices

Discover

Ask a Question
  1. All Topics
  2. Topic
    Business
  3. Study Set
    Managerial Economics
  4. Exam
    Exam 5: Theory of Consumer Behavior
  5. Question
    In the Following Graph the Consumer's Income Is $1,200
Solved

In the Following Graph the Consumer's Income Is $1,200

Question 65

Question 65

Multiple Choice

In the following graph the consumer's income is $1,200.At what price of Y are Y2 units demanded?
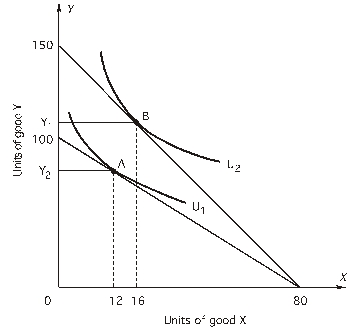
 In the following graph the consumer's income is $1,200.At what price of Y are Y<sub>2</sub> units demanded?   A) $ 8 B) $10 C) $15 D) $16 E) $12


A) $ 8
B) $10
C) $15
D) $16
E) $12

Correct Answer:

verifed

Verified

Unlock this answer now
Get Access to more Verified Answers free of charge

Related Questions

Q60: <br>The price of X is $20 and

Q61: Alexandra consumes only caviar and champagne,but she

Q62: The consumer chooses the bundle of goods

Q63: <img src="https://d2lvgg3v3hfg70.cloudfront.net/TB7882/.jpg" alt=" -According to the

Q64: Along an indifference curve<br>A)the MRS is constant.<br>B)the

Q66: The price of X is $20 and

Q67: Suppose a consumer who purchases only two

Q68: rate at which a consumer is ABLE

Q69: The figure below shows a consumer maximizing

Q70: Which of the following assumptions is(are)NOT made

Examlex

ExamLex

About UsContact UsPerks CenterHomeschoolingTest Prep

Work With Us

Campus RepresentativeInfluencers

Links

FaqPricingChrome Extension

Download The App

Get App StoreGet Google Play

Policies

Privacy PolicyTerms of ServiceHonor CodeCommunity Guidelines

Scan To Download

qr-code

Copyright © (2025) ExamLex LLC.

Privacy PolicyTerms Of ServiceHonor CodeCommunity Guidelines