Multiple Choice
Which of these statistics BEST describes the relationship in this scatterplot? 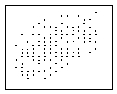
A) r = 1.00
B) r = .40
C) r = -.40
D) r = .00
Correct Answer:

Verified
Correct Answer:
Verified
Related Questions
Q33: A researcher collects data from 18
Q34: A survey of Psychology majors finds that
Q35: Which of the following statements best illustrates
Q36: The Pearson correlation coefficient (r) measures the
Q37: A recent study found that the older
Q39: You calculate a correlation coefficient (rather than
Q40: A researcher finds that the more hours
Q41: Which of these statistics best describes the
Q42: You calculate a correlation coefficient (rather than
Q43: A researcher calculates a correlation of .52