Multiple Choice
Which of these statistics BEST describes the relationship in this scatterplot? 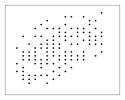
A) r = .00
B) r = .50
C) r = -.50
D) r = 1.00
Correct Answer:

Verified
Correct Answer:
Verified
Related Questions
Q46: The Spearman rank-order correlation measures the relationship
Q47: A researcher hypothesizes college grade point average
Q48: You calculate a correlation coefficient (rather than
Q49: For which of these research situations would
Q50: A researcher calculates a correlation of .39
Q52: Which of these statistics BEST describes the
Q53: The _ of a Pearson correlation coefficient
Q54: You believe students are less attentive in
Q55: A researcher calculates a correlation of .49
Q56: Which of these is NOT one of