Multiple Choice
Which of these statistics best describes the relationship in this scatterplot? 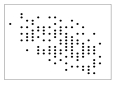
A) r = .00
B) r = .40
C) r = -1.00
D) r = -.50
Correct Answer:

Verified
Correct Answer:
Verified
Related Questions
Q96: You would calculate a correlation coefficient (rather
Q97: A researcher wishing to correlate two variables
Q98: The Pearson correlation coefficient (r) assumes the
Q99: A researcher calculates a correlation of .42
Q100: A researcher calculates a value of .85
Q102: For which of these research situations would
Q103: Which of the following statements best illustrates
Q104: An instructor finds she is completely unable
Q105: A recent study found that the more
Q106: The Pearson correlation coefficient (r) assumes the