Multiple Choice
Which of these statistics BEST describes the relationship in this scatterplot? 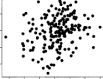
A) r = .50
B) r = -.50
C) r = -1.00
D) r = .00
Correct Answer:

Verified
Correct Answer:
Verified
Related Questions
Q5: For which of these research situations would
Q6: An instructor finds the more often students
Q7: A Pearson correlation of .00 is BEST
Q8: Calculating the Pearson correlation involves calculating eight
Q9: For which of these research situations would
Q11: A researcher wishing to correlate two variables
Q12: You believe faculty members call on students
Q13: An instructor finds that, in general, the
Q14: Which of these is NOT one of
Q15: A researcher calculates a value of .15