Multiple Choice
What did the researcher do to cause the change in the shaded regions from Distribution A to Distribution B? 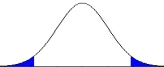 Distribution A
 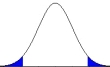 Distribution B
A) She increased the size of her sample.
B) She changed alpha from .05 to .10.
C) She changed from a directional to a non-directional alternative hypothesis.
D) She calculated a t-test rather than an F-ratio.
Correct Answer:

Verified
Correct Answer:
Verified
Q33: For a t-statistic = 2.56 with 20
Q34: This distribution illustrates a _. <img src="https://d2lvgg3v3hfg70.cloudfront.net/TB7886/.jpg"
Q35: This distribution illustrates a _. <img src="https://d2lvgg3v3hfg70.cloudfront.net/TB7886/.jpg"
Q36: For a t-statistic = 3.20 with 10
Q37: In reporting a statistical analysis, a researcher
Q39: When you _, this implies the probability
Q40: Which type of statistic would be appropriate
Q41: You determine whether the probability of a
Q42: When you _, this implies the probability
Q43: A researcher conducts a study measuring 10