Multiple Choice
In this figure, the shaded areas represent ______. 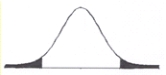
A) values of the statistic with a low probability of occurring
B) the region of non-rejection
C) the symmetry of the distribution
D) 95% of the distribution
Correct Answer:

Verified
Correct Answer:
Verified
Related Questions
Q92: Which of the following variables would NOT
Q93: A binomial distribution is used for a
Q94: In which of the following steps of
Q95: In which of the following steps of
Q96: Which of the following beliefs is most
Q98: Which of the following is an important
Q99: α refers to _.<br>A) the region of
Q100: Which of the following BEST addresses the
Q101: Which of the following BEST addresses the
Q102: Which of the following is the first