Multiple Choice
A learning curve describes the rate at which a person learns certain specific tasks. If N is the number of words per minute typed by a student. So for an average student 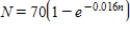
Where n is the number of days of instruction. What does the graph of this formula look like?
A) 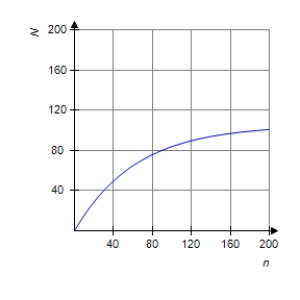
B) 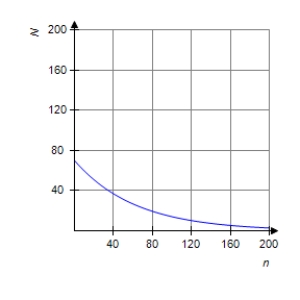
C) 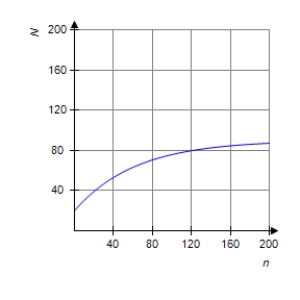
D) 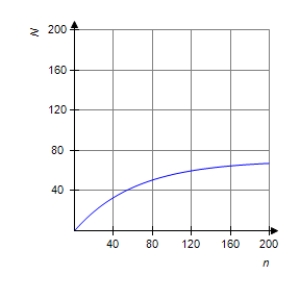
Correct Answer:

Verified
Correct Answer:
Verified
Q49: Graph the first-degree inequality in two unknowns.
Q50: Sketch the graph of the equation.
Q51: Find three ordered pairs that satisfy the
Q52: Graph the first-degree inequality in two unknowns.
Q53: Sketch the graph of the equation.
Q55: Let P(x) be the number of prime
Q56: Identify the curve.<br><br> <img src="https://d2lvgg3v3hfg70.cloudfront.net/TB7816/.jpg" alt="Identify the
Q57: Graph the first-degree inequality in two unknowns.
Q58: State whether the statement is true or
Q59: Find the difference quotient, <img src="https://d2lvgg3v3hfg70.cloudfront.net/TB7816/.jpg" alt="Find