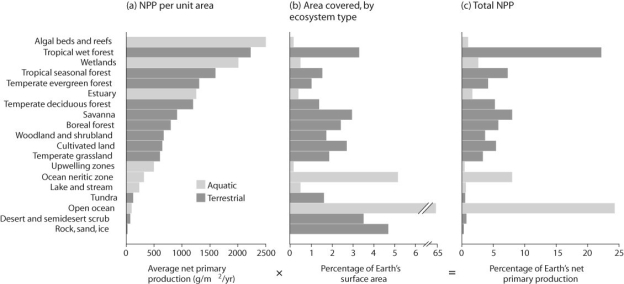
menu-iconExamlexExamLexServices

Discover

Ask a Question
  1. All Topics
  2. Topic
    Biology
  3. Study Set
    Biological Science Study Set 3
  4. Exam
    Exam 53: Ecosystems and Global Ecology
  5. Question
    Figure 53.3 -In the Figure Above, How Is Net Primary Productivity Represented
Solved

Figure 53.3 -In the Figure Above, How Is Net Primary Productivity Represented

Question 31

Question 31

Multiple Choice

  Figure 53.3 -In the figure above, how is net primary productivity represented? A)  organized by biome B)  organized by region C)  organized by geography D)  randomly organized Figure 53.3
-In the figure above, how is net primary productivity represented?


A) organized by biome
B) organized by region
C) organized by geography
D) randomly organized

Correct Answer:

verifed

Verified

Unlock this answer now
Get Access to more Verified Answers free of charge

Related Questions

Q26: When primary producers expend energy to build

Q27: <img src="https://d2lvgg3v3hfg70.cloudfront.net/TB6548/.jpg" alt=" Figure 53.4 -After

Q28: What is the leading hypothesis as to

Q29: At the Hubbard Brook Experimental Forest in

Q30: Why are changes in the global carbon

Q32: <img src="https://d2lvgg3v3hfg70.cloudfront.net/TB6548/.jpg" alt=" Figure 53.8 -Considering

Q33: If the flow of energy in an

Q34: <img src="https://d2lvgg3v3hfg70.cloudfront.net/TB6548/.jpg" alt=" Figure 53.5 -After

Q35: You own 300 acres of patchy temperate

Q36: Use the following information when answering the

Examlex

ExamLex

About UsContact UsPerks CenterHomeschoolingTest Prep

Work With Us

Campus RepresentativeInfluencers

Links

FaqPricingChrome Extension

Download The App

Get App StoreGet Google Play

Policies

Privacy PolicyTerms of ServiceHonor CodeCommunity Guidelines

Scan To Download

qr-code

Copyright © (2025) ExamLex LLC.

Privacy PolicyTerms Of ServiceHonor CodeCommunity Guidelines