Multiple Choice
Use the following graph and information to answer the question below.
Flycatcher birds that migrate from Africa to Europe feed their nestlings a diet that is almost exclusively moth cat The graph shows the mean dates of arrival, bird hatching, and peak caterpillar season for the years 1980 and 200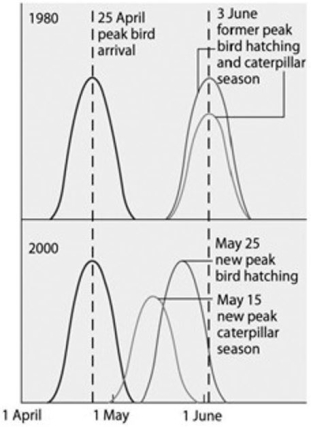
What is the shift in the peak of caterpillar season most likely due to?
A) acid precipitation in Europe
B) earlier migration returns of flycatchers
C) an innate change in the biological clock of the caterpillars
D) pesticide use
E) global warming
Correct Answer:

Verified
Correct Answer:
Verified
Q9: <img src="https://d2lvgg3v3hfg70.cloudfront.net/TB6548/.jpg" alt=" Figure 53.3 -Which
Q10: Use the following information when answering the
Q11: Considering the global carbon cycle, where is
Q12: <img src="https://d2lvgg3v3hfg70.cloudfront.net/TB6548/.jpg" alt=" Figure 53.3 -Which
Q13: Considering the current scientific literature on global
Q15: <img src="https://d2lvgg3v3hfg70.cloudfront.net/TB6548/.jpg" alt=" Figure 53.9 -Upon
Q16: What is the main reason for using
Q17: Which statement best describes what ultimately happens
Q18: Which of the following is a consequence
Q19: Which of the following is not a