Multiple Choice
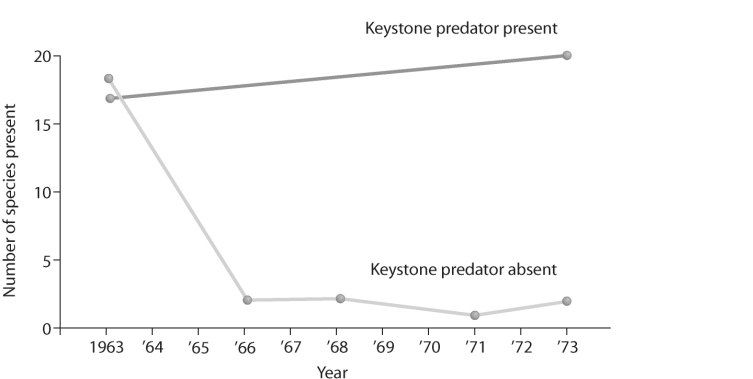 Figure 52.7
-What does the graph in the figure above tell you about the definition of a keystone species?
A) A keystone species added to a community can make it more robust.
B) A keystone species has little interaction with other species in an environment.
C) A keystone species removed from a community could have drastic effects.
D) A keystone species can be any species.
Correct Answer:

Verified
Correct Answer:
Verified
Q18: <img src="https://d2lvgg3v3hfg70.cloudfront.net/TB6548/.jpg" alt=" Figure 52.9 -In
Q19: <img src="https://d2lvgg3v3hfg70.cloudfront.net/TB6548/.jpg" alt=" Figure 52.2 -What
Q20: While traveling in Texas, you stumble across
Q21: Snails typically avoid sunlit areas, but some
Q22: <img src="https://d2lvgg3v3hfg70.cloudfront.net/TB6548/.jpg" alt=" Figure 52.8 -Clements's
Q24: What is a likely reason for the
Q25: During succession, tall canopies of maple trees
Q26: Which of the following is not a
Q27: In a particular case of secondary succession,
Q28: Refer to the grids below to answer