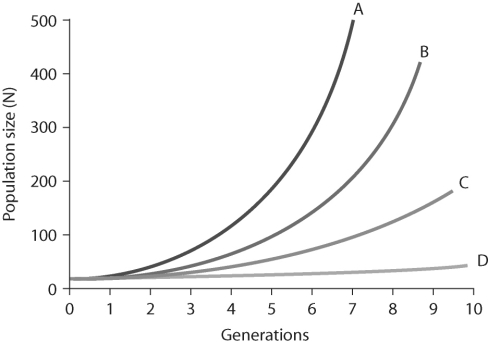
menu-iconExamlexExamLexServices

Discover

Ask a Question
  1. All Topics
  2. Topic
    Biology
  3. Study Set
    Biological Science Study Set 3
  4. Exam
    Exam 51: Population Ecology
  5. Question
    Figure 51.4 -In the Figure Above, Which of the Lines Represents the Represents
Solved

Figure 51.4 -In the Figure Above, Which of the Lines Represents the Represents

Question 31

Question 31

Multiple Choice

      Figure 51.4 -In the figure above, which of the lines represents the highest per- capita rate increase r) ? A)  line A B)  line B C)  line C D)  line D
      Figure 51.4 -In the figure above, which of the lines represents the highest per- capita rate increase r) ? A)  line A B)  line B C)  line C D)  line D Figure 51.4
-In the figure above, which of the lines represents the highest per- capita rate increase r) ?


A) line A
B) line B
C) line C
D) line D

Correct Answer:

verifed

Verified

Unlock this answer now
Get Access to more Verified Answers free of charge

Related Questions

Q26: <span class="ql-formula" data-value="\text {Life Table for Lacerta

Q27: Why can't a female lizard have both

Q28: (a) Density dependence: Growth rate slows at

Q29: What can we NOT determine from examining

Q30: <img src="https://d2lvgg3v3hfg70.cloudfront.net/TB6548/.jpg" alt=" Figure 51.10 -Based

Q32: Suppose researchers marked 800 turtles and later

Q33: Which statement about K is FALSE?<br>A) K

Q34: (a)<br><img src="https://d2lvgg3v3hfg70.cloudfront.net/TB6548/.jpg" alt="(a) (b)

Q35: The regular fluctuations in size of animal

Q36: You observe two female fish of the

Examlex

ExamLex

About UsContact UsPerks CenterHomeschoolingTest Prep

Work With Us

Campus RepresentativeInfluencers

Links

FaqPricingChrome Extension

Download The App

Get App StoreGet Google Play

Policies

Privacy PolicyTerms of ServiceHonor CodeCommunity Guidelines

Scan To Download

qr-code

Copyright © (2025) ExamLex LLC.

Privacy PolicyTerms Of ServiceHonor CodeCommunity Guidelines