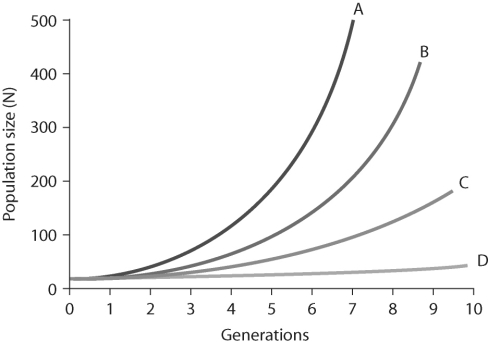
menu-iconExamlexExamLexServices

Discover

Ask a Question
  1. All Topics
  2. Topic
    Biology
  3. Study Set
    Biological Science Study Set 3
  4. Exam
    Exam 51: Population Ecology
  5. Question
    Figure 51.4 -In the Figure Above, Which of the Lines Represents Exponential
Solved

Figure 51.4 -In the Figure Above, Which of the Lines Represents Exponential

Question 37

Question 37

Multiple Choice

      Figure 51.4 -In the figure above, which of the lines represents exponential growth? A)  line A B)  line B C)  line C D)  line D E)  all of the above
      Figure 51.4 -In the figure above, which of the lines represents exponential growth? A)  line A B)  line B C)  line C D)  line D E)  all of the above Figure 51.4
-In the figure above, which of the lines represents exponential growth?


A) line A
B) line B
C) line C
D) line D
E) all of the above

Correct Answer:

verifed

Verified

Unlock this answer now
Get Access to more Verified Answers free of charge

Related Questions

Q32: Suppose researchers marked 800 turtles and later

Q33: Which statement about K is FALSE?<br>A) K

Q34: (a)<br><img src="https://d2lvgg3v3hfg70.cloudfront.net/TB6548/.jpg" alt="(a) (b)

Q35: The regular fluctuations in size of animal

Q36: You observe two female fish of the

Q38: The study of factors that determine the

Q39: Conservationists will take snow geese off the

Q40: Which of these terms defines how the

Q41: Why can't a female lizard have both

Q42: An ecologist recorded 12 white- tailed deer,

Examlex

ExamLex

About UsContact UsPerks CenterHomeschoolingTest Prep

Work With Us

Campus RepresentativeInfluencers

Links

FaqPricingChrome Extension

Download The App

Get App StoreGet Google Play

Policies

Privacy PolicyTerms of ServiceHonor CodeCommunity Guidelines

Scan To Download

qr-code

Copyright © (2025) ExamLex LLC.

Privacy PolicyTerms Of ServiceHonor CodeCommunity Guidelines