Multiple Choice
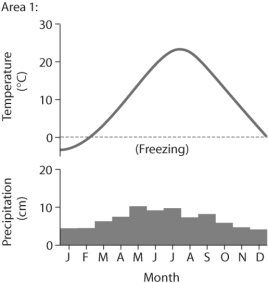
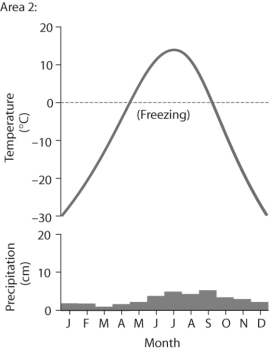 Figure 49.3
-Based on the data in the figure above, which of the following statements is FALSE?
A) Area 2 has a smaller annual temperature variation compared to area 1.
B) Area 1 has more average precipitation than area 2.
C) Both areas have variation in monthly precipitation.
D) Area 1 has a higher average temperature than area 2.
Correct Answer:

Verified
Correct Answer:
Verified
Q10: A fish species known for its success
Q11: A fish swimming into a bog environment
Q12: What is the main reason that polar
Q13: If the Earth were to reorient such
Q14: Every place on Earth receives the same
Q16: In which terrestrial area is global warming
Q17: Which of the following statements regarding turnover
Q18: Which level of ecological study focuses the
Q19: What is the main difference between climate
Q20: What would happen to the seasons if