Multiple Choice
Use the graphs in Figures 29.4 and 29.5 and the following information when answering the corresponding questions.
Canadian and Swiss researchers van der Heijden et al., 1998) interested in factors affecting biodiversity, grew a variety of gra plants in combination with one of four arbuscular mycorrhizal AMF) species, no AMF, or all four AMF species together; and measured plant growth under each set of conditions. All plant species were grown in each plot, so they always competed with each other with the only difference being which AMF were present. Use the graphs in Figure 31.5 to answer the questions
that follow. Note that the x- axis labels indicate the number and identity of AMF species bar 0 = no fungi; bars A- D = individual AMF species; bar A+B+C+D = all AMF species together) . The y- axis indicates the amount grams) of plant biomass for the species shown in italics above each graph. Graph e) is the total biomass grams) of all 11 plant species combined; graph f) is the biomass of Bromus erectus plants only, separated from the total.
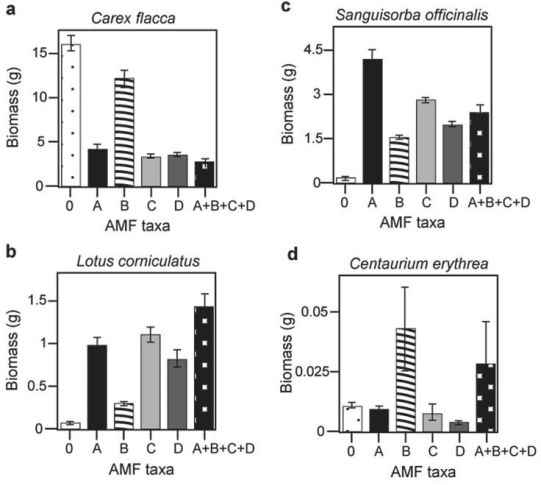 Figure 29.4
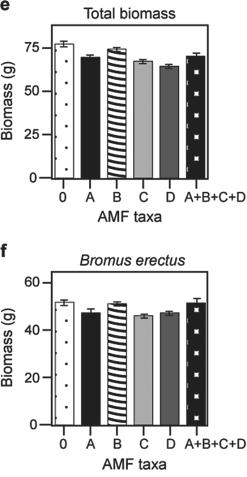 Figure 29.5
-Using grams of biomass as an indicator of abundance, which species is most likely the dominant species in this ecosystem see Figure 29.5) ?
A) Centaurium erythrea
B) Sanguisorba officinalis
C) Carax flacca
D) Bromus erectus
Correct Answer:

Verified
Correct Answer:
Verified
Q22: Why is it more difficult to treat
Q23: Why is it important that ectomycorrhizal fungi
Q24: Which of the trees provided depicts the
Q25: When pathogenic fungi are found growing on
Q26: Use the following information when answering the
Q28: Predict what you would see if you
Q29: Use the following information when answering the
Q30: <img src="https://d2lvgg3v3hfg70.cloudfront.net/TB6548/.jpg" alt=" Figure 29.3 -Referring
Q31: If seedlings in the shade commonly do
Q32: Use the following information when answering the