Multiple Choice
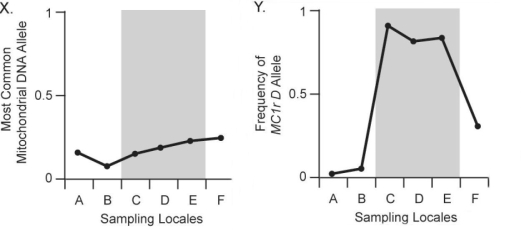
Figure 22.3
In Figure 22.3, chart X above shows the frequency of the most common neutral mitochondrial DNA allele an all gene that does not affect and is not linked to coat colour) across six pocket- mouse populations. Populations C, D and E live on dark volcanic rock; populations A, B, and F live on light- coloured granite. Compare this figure with chart Y above. What should you conclude after comparing these two figures?
A) The most common neutral mitochondrial DNA allele varies more among populations than the Mc1r D allele.
B) Little to no correlation exists between neutral mitochondrial DNA alleles and habitat colour.
C) The most common neutral mitochondrial DNA allele is strongly associated with the frequency of the Mc1r D allele.
D) The most common neutral mitochondrial DNA allele is strongly associated with substrate colour.
Correct Answer:

Verified
Correct Answer:
Verified
Q17: Which of these conditions are always true
Q33: Researchers have found fossils of Eocene horse
Q34: Use the following information when answering the
Q35: A farmer uses triazine herbicide to control
Q36: The following questions) are based on information
Q37: Why did Darwin argue that evidence of
Q39: Which statement about transitional features is true?<br>A)
Q40: Which of the following is the best
Q41: The following questions) are based on information
Q42: A patient has finished his treatment for