Multiple Choice
TABLE 17-2
A political pollster randomly selects a sample of 100 voters each day for 8 successive days and asks how many will vote for the incumbent. The pollster wishes to construct a p chart to see if the percentage favoring the incumbent candidate is too erratic. 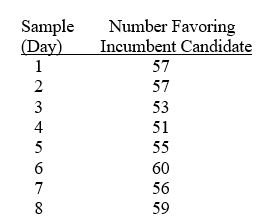
-Referring to Table 17-2, what is the numerical value of the center line for the p chart?
A) 0.53
B) 0.56
C) 0.63
D) 0.66
Correct Answer:

Verified
Correct Answer:
Verified
Q29: TABLE 17-9<br>The manufacturer of canned food constructed
Q30: TABLE 17-9<br>The manufacturer of canned food constructed
Q31: TABLE 17-10<br>Below is the number of defective
Q32: TABLE 17-9<br>The manufacturer of canned food constructed
Q33: Referring to Table 17-7, construct an <img
Q35: Referring to Table 17-3, suppose the analyst
Q36: TABLE 17-10<br>Below is the number of defective
Q38: Referring to Table 17-4, what percentage of
Q39: Which of the following is not one
Q142: Which of the following is not part