Multiple Choice
TABLE 17-4
A factory supervisor is concerned that the time it takes workers to complete an important production task (measured in seconds) is too erratic and adversely affects expected profits. The supervisor proceeds by randomly sampling 5 individuals per hour for a period of 10 hours. The sample mean and range for each hour are listed below.
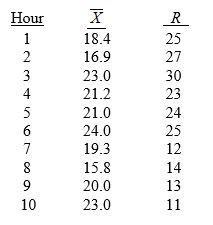
She also decides that lower and upper specification limit for the critical-to-quality variable should be 10 and 30 seconds, respectively.
-Referring to Table 17-4, suppose the sample mean and range data were based on 6 observations per hour instead of 5. How would this change affect the lower and upper control limits of an R chart?
A) LCL would increase; UCL would decrease.
B) LCL would remain the same; UCL would decrease.
C) Both LCL and UCL would remain the same.
D) LCL would decrease; UCL would increase.
Correct Answer:

Verified
Correct Answer:
Verified
Q1: _ causes of variation are correctable without
Q91: Special or assignable causes of variation are
Q95: TABLE 17-7<br>A supplier of silicone sheets for
Q96: TABLE 17-9<br>The manufacturer of canned food constructed
Q97: Referring to Table 17-7, an <img src="https://d2lvgg3v3hfg70.cloudfront.net/TB1602/.jpg"
Q98: TABLE 17-4<br>A factory supervisor is concerned that
Q100: Referring to Table 17-7, what is the
Q102: Cpk > 1 indicates that the process
Q103: TABLE 17-3<br>A quality control analyst for a
Q104: TABLE 17-6<br>The maker of a packaged candy